Sales
Sales - US
North America - Gift Card Growth - 2028
Digital Gift Cards are expected to grow to 60% of all Gift Card Spending.
Market Potential: The US digital gift card market is forecasted to grow at 17.1% annually.**
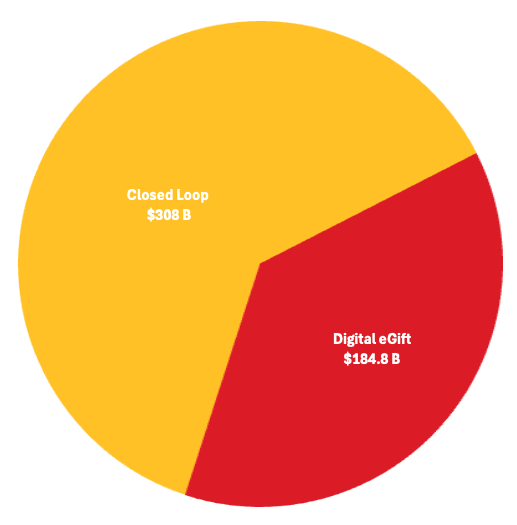
North America
Closed Loop = $308B
eGift = $184.8B
includes US, Canada, Caribbean, Mexico
United States
Closed Loop = $267.3B
eGift = $160.38B
Canada
Closed Loop = $26B
eGift = $15.6B
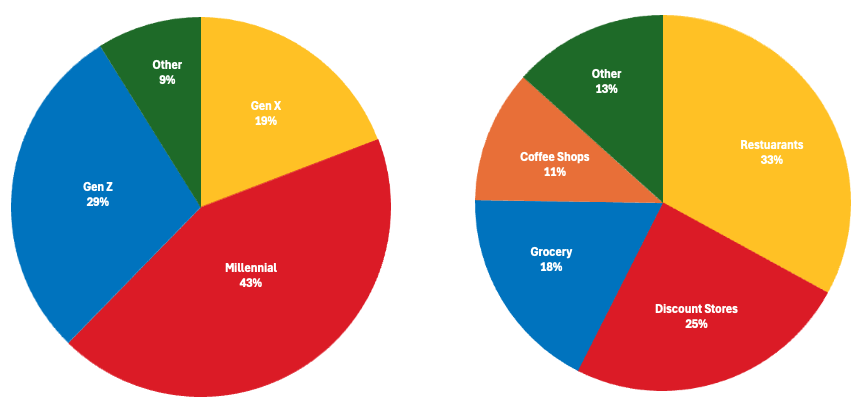
By Retail Segment
Purchasers by Generational Segment
Shell $240M

*Credence Research and Napco Research 2023
**The Entrepreneurship Reporter
Industry Standards (2025)
Emerging Digital Innovations
Fraud Mitigation and Rising Costs:
Direct Sales Alignment and Marketing
Promotional and Partner Collaboration
B2B Digital Initiatives
Shell US 2025 Sales Update
Overview
Growth Initiatives
Shell US 2026 Forecast
Sales - Canada
Trends | Market Research
US Regulatory Changes
Incentive Market Industry News & Trends
Digital eGift Cards

| Digital eGift Card | No Digital eGift Card |